Like many, I took Buster's injury pretty hard. Witnessing something like that puts a pretty bad taste in your mouth. It got to the point where I almost didn't even want to watch the team play on TV. Buster's absence was a constant reminder of all that had happened.
But in an effort to practice what I preached, I returned to the ballpark Monday to see the Giants battle the Montreal Expos, and more specifically, in hopes of seeing Tim Lincecum's 1000th career strikeout.
The game was eerily similar to Buster's night, almost to the point that I feared some new cataclysmic tragedy was about to take place. The Giants went down early, erased a 4-run deficit late, and battled through extra innings. What's more is I was sitting in practically the same exacts seats. As an incredibly superstitious fan who refuses to take an additional sip of beer or put on an extra layer of clothing during a tie game, the similarities were making me more than a bit nervous. As I learned the night of Buster's injury, I'd take a loss as long as no one else got critically injured.
But luckily, the only injuries suffered were to the morale of the Washington Nationals -- and to those poor souls in Section 135 bombarded with poop from an armada of impatient seagulls. They always win.
You have to love extra-inning baseball games, particularly when it reaches the 13th inning. That's the real deal. The stadium empties to nothing but the borderline-unhealthy fans who wouldn't freaking fathom leaving a game at 11:45pm on a Monday night against the Washington Nationals. They're the fans who cheered like the team had just won another World Series after learning the Giants' had struck out 13 hitters, thus earning them a coupon for a free pack of Johnsonville Bratwursts. Best of all, you get to see the Giants Media team dig to the deep cuts of between-inning "rally video montages." Animal House -- check. Cheers -- check. 'Lil Jon -- check. Billy Madison -- check. Dr. Quinn Medicine Woman -- check. Wait, what?


 |
| Flipbook of Tim's delivery. |


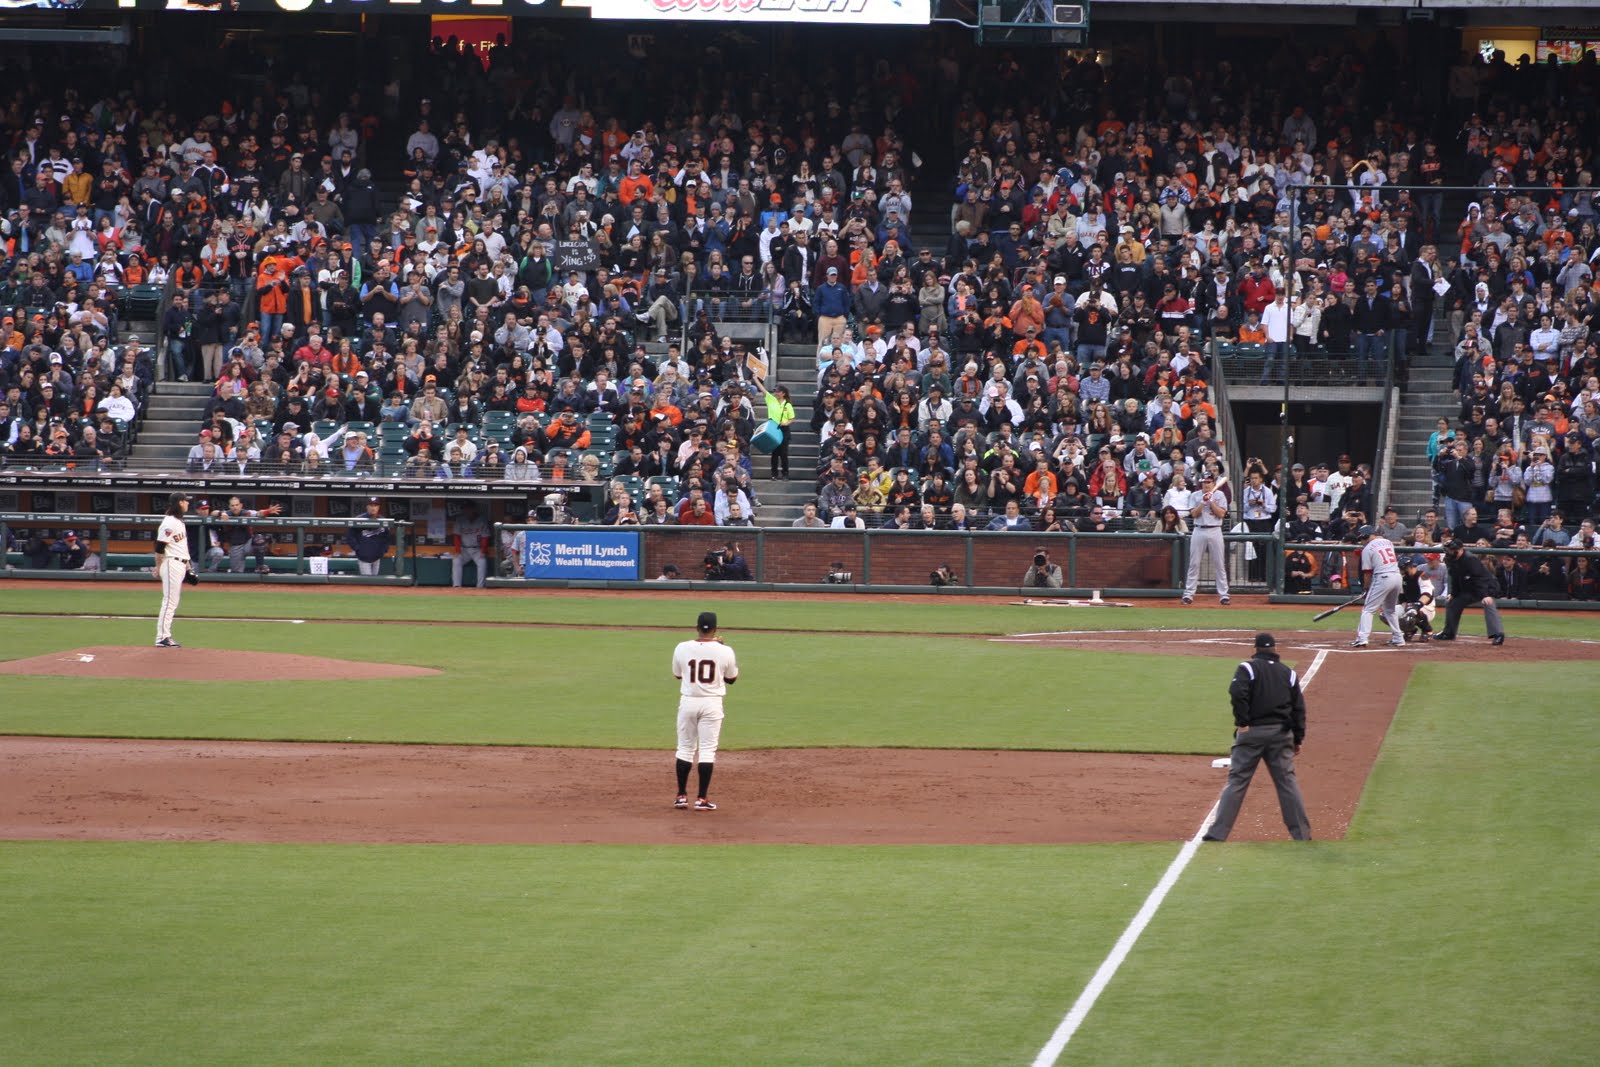 |
| Flipbook of Tim's 1000th Career Strikeout |


---
In other news, Freddy Sanchez is starting to make a legitimate case for himself as a 2011 NL All-Star. He currently ranks 5th in the All-Star voting behind Brandon Phillips (CIN), Rickie Weeks (MIL), Chase Utley (HELL) and Dan Uggla (ATL). His RBI and Run totals don't quite measure up to those of some of the front-runners, but his .296 batting average ranks 2nd among NL second basemen. He also ranks 2nd in hits and 1st in doubles. For Giants fans, though, it seems like Freddy has an All-Star quality that isn't measured in stats. He's been the guy keeping this sinking offense afloat. That got me thinking -- there should be a stat that would somehow represent a batter's worth in relation to his team's scoring. That led me to TRI - Team Run Involvement. Call me Bill James.
TRI is a stat that adds a player's RBI and Run totals, subtracts his HR* total and then divides that number by his team's total runs scored on the season. What it gives you is a percentage of the team's total runs for which Player X is directly responsible, either have scored the run or driven in the run.
TRI=(Player RBI + Player Runs - Player HR)/Team Runs
Maybe this stat already exists, but I don't hear it mentioned. And in the case of a guy like Freddy Sanchez, it reflects his significance in the Giants' offense.
So that got me thinking -- where does Freddy Sanchez rank among his All-Star Competition?
Well, Freddy Sanchez with his 24 RBI, 21 runs and 3 HR divided by the Giants 217 runs has a TRI of .194, meaning Freddy has scored or driven in almost 20% of all Giants runs. Top vote-getter Brandon Phillips has a TRI of .208. Rickie Weeks tops all 3 at .222.
Dan Uggla, mired in a season long slump, registers at a sickly .130. Chase Utley, who missed almost the entire year with injury, scores an understandably low .033.
But who, you ask, leads all NL Second Basemen in the exciting new stat of TRI? None of the aforementioned stars, that's for sure. It is the great Niel Walker of your Pittsburgh Pirates. Walker's 34 Runs and 39 RBI over the Pirates 227 total runs give him an astounding .286 TRI. That's flat out incredible. Walker has scored or driven well over a quarter of the Pirates' run in 2011.
So vote Freddy for the All-Star game if you want, but punch a few ballots for his replacement in Pittsburgh, Neil Walker. He is at this point, the TRI king.
* The reason we subtract number of player homerruns is so that he doesn't get counted twice for influencing only 1 team run. Props to Tom for bringing this issue up in the comments section. Eric and I discussed it for some time and while I originally figured the player should be rewarded for both driving in and scoring a run, the fact of the matter is, a home run leads to only 1 team run. The goal is to figure how many of a team's total runs were influenced by Player X. Since a HR gives a player two "points" (1 RBI and 1 Run) and only adds 1 team run, HR total must be subtracted.
* The reason we subtract number of player homerruns is so that he doesn't get counted twice for influencing only 1 team run. Props to Tom for bringing this issue up in the comments section. Eric and I discussed it for some time and while I originally figured the player should be rewarded for both driving in and scoring a run, the fact of the matter is, a home run leads to only 1 team run. The goal is to figure how many of a team's total runs were influenced by Player X. Since a HR gives a player two "points" (1 RBI and 1 Run) and only adds 1 team run, HR total must be subtracted.
Not sure if you're already doing this, but you should subtract the player's number of home runs from the RBI+runs total before dividing by the team total. Homers are counted twice, once in RBI's and once in runs, and that would cancel out the double-counting.
ReplyDeleteThat's a really good point. I had to think about that for a while, but I think you're exactly right.
ReplyDeleteIf Freddy Sanchez hits a solo HR, it only leads to 1 run for the team. Thus, he was technically only "involved" in 1 run.
Initially I thought you should include Home Runs since the player is both scoring and driving in the run, and should be rewarded as such.
But since the goal of the stat is to simply figure out what percentage of the team's runs Player X influenced, he shouldn't get 2 "points" for 1 run scored for the team.
Exactly. And I think this change may actually skew the numbers in Freddy's favor, since he has relatively few HRs. For instance, Rickie Weeks has 11 HRs to Freddy's 3, so thats 8 extra runs inflating Weeks' stat.
ReplyDeleteYeah, I just reposted with the new figures. Weeks still tops Freddy, but the margin is smaller. Walker still leads the pack by a pretty wide margin.
ReplyDeleteThanks for giving it enough thought to catch the HR issue!
Hella cool! n junk
ReplyDelete